
Process Investigation
Can you really see what THIS process is doing?
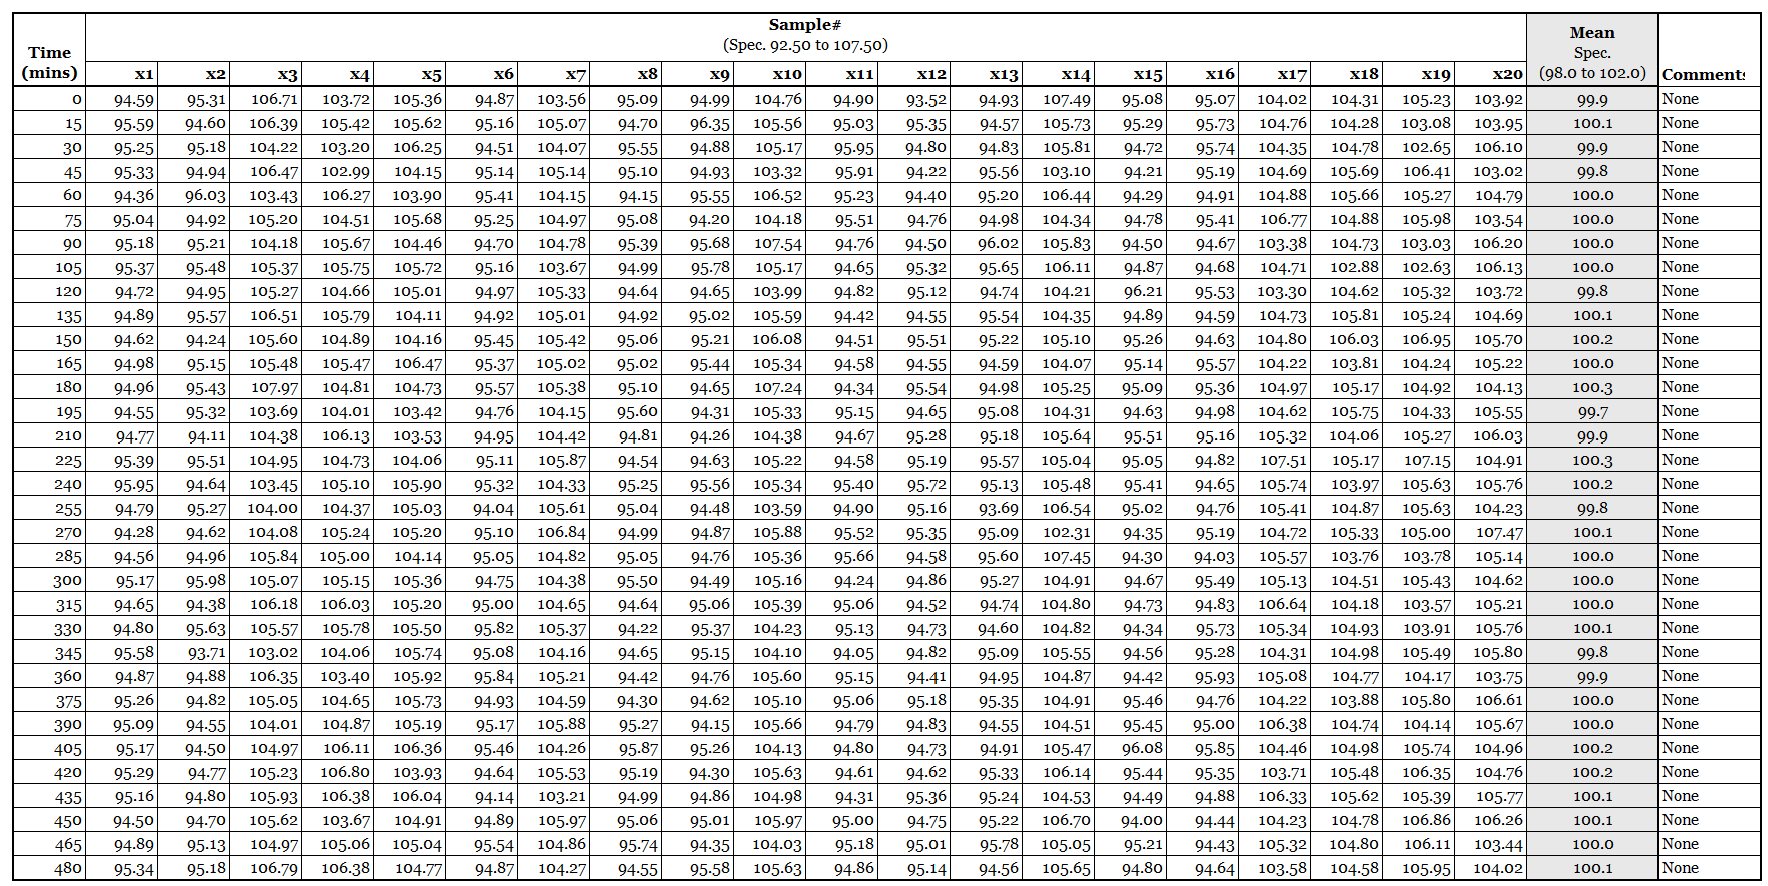
Batch records often present process data in this format.
During tablet compression twenty individual tablets are weighed every fifteen minutes - 10 from the LEFT side and 10 from the RIGHT side of the press. The mean weight of the twenty tablets is calculated and recorded alongside the individual results.
All Tablets Within Specification. But Is the Process Representative and Under Control?
-
Two specification checks are applied.
Each tablet must fall within the individual tablet specification of
92.50 to 107.50 mgThe mean of the twenty tablets must fall within the tighter mean specification of 98.0 to 102.0 mg
Every value in this table complies with both requirements.
This format appears in batch records, technical reports, and CMC regulatory submissions across the industry. The data demonstrate compliance with specification at each sampling point.
Yet the table contains more than six hundred measurements. A reader must scan hundreds of numbers to understand what the process did during the batch. The format proves compliance. It does not show how the process behaved.Did the process drift?
Did variation increase?
Did a shift occur during compression?
Is something else going on?
-
Statistical analysis converts the same measurements into information about process behavior. Patterns, shifts, and instability become visible. This allows investigation while the process still meets specification, rather than waiting until a failure occurs.
This view helps identify where differences may exist within the process. Variation between analysts, shifts in mean position, or unusual patterns can often be seen immediately. The chart does not attempt to explain the cause. It provides a structured starting point for reviewing the data.
However the interpretation is still limited because the order of data may not reflect how the process actually operates. Important patterns can remain hidden when measurements from different conditions are combined.
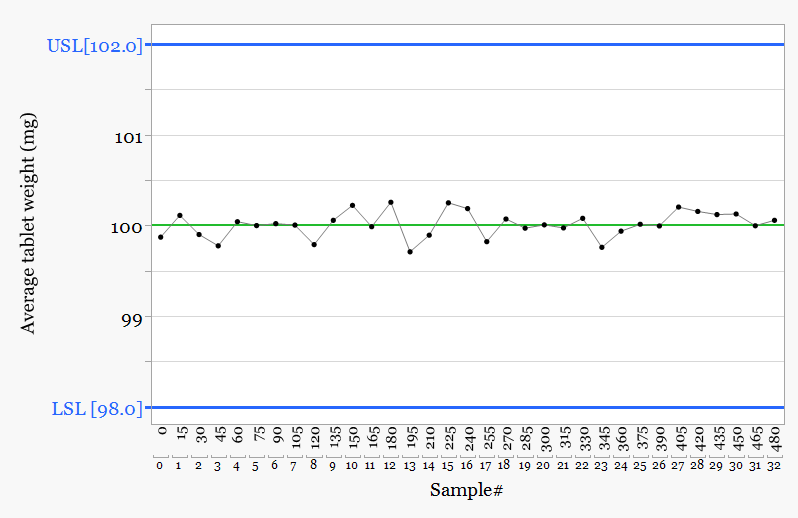
The chart above shows the mean tablet weight calculated from the twenty tablets collected every fifteen minutes.
-
The average remains close to target and stays comfortably within the specification limits of 98.0 to 102.0 mg.
However averaging twenty tablets removes of the variability between individual units. The chart therefore shows only whether the process center moves.
Manufacturing produces individual tablets, not averages. Meaningful changes in individual tablet behavior can occur while the mean remains well within specification.
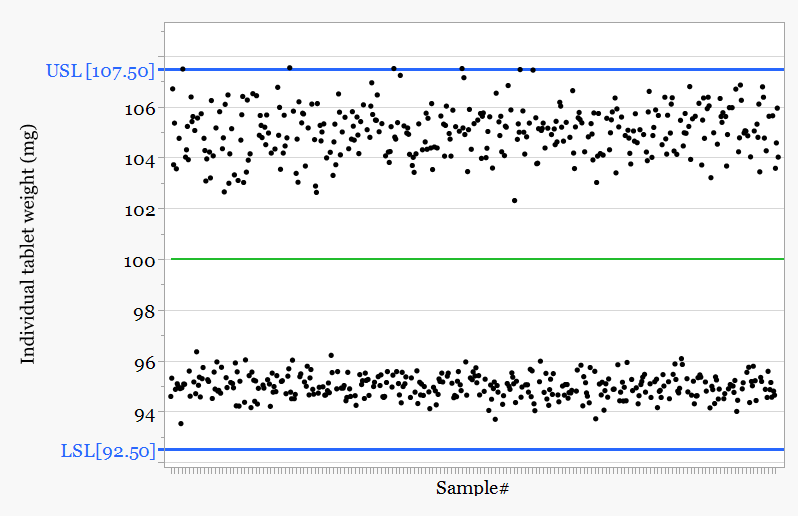
Plotting the individual tablet weights reveals information hidden in the table.
Two distinct populations appear. One group sits close to the upper specification limit while the second group sits far lower in the distribution.
-
The calculated mean sits between the two groups. It does not represent either population and therefore does not represent the tablets being produced.
The pattern persists across the entire batch, which indicates systematic behaviour rather than random variation.
One population operates close to the upper specification limit while the second operates comfortably above the lower specification limit.
The batch meets specification. The question now becomes why two different tablet populations are produced during the same run.
1. With some Process Context
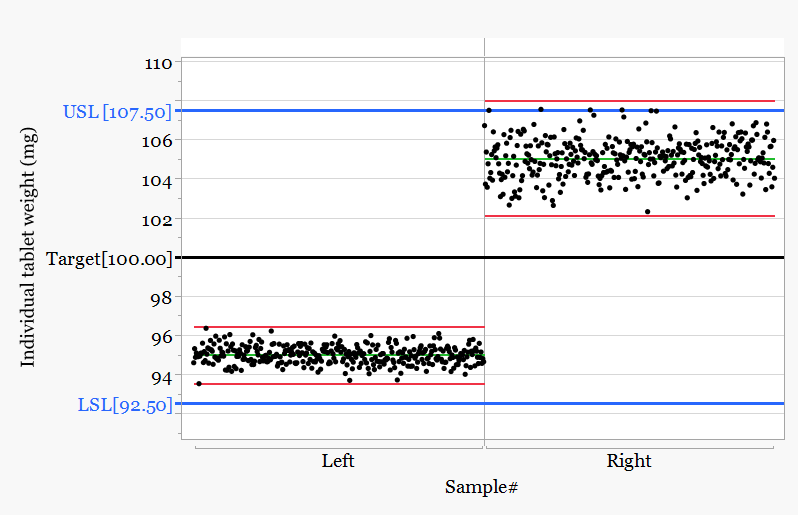
With process context the pattern becomes clear.
The tablet press operates with two sides. Each side uses its own cam which controls compression behavior and therefore tablet weight.
2. Batch record revision
The batch record required twenty tablets every fifteen minutes but gave no instruction to sample separately from the left and right sides of the press. Ten tablets came from each side but the results were combined in one table.
-
Batch record format changed from tables to graphical process behavior charts
Separate charts created for the left and right sides of the press
Target and consistent action limits established for each side
A simple rule set introduced to identify unusual behavior in batch record
Operators, QA, and engineering received practical SPC training
Engineering incorporated simple SPC methods into the compression testing program
3. Actions taken
A simple SPC approach was introduced to make process behavior visible and support consistent decisions during batch record review.
QC Challenges

Process Behavior Charts first appeared in fast moving manufacturing environments. Over time their use expanded across many organizational activities.
Quality Control provides a strong example.
-
With process context the pattern becomes clear.
The tablet press operates with two sides. Each side uses its own cam which controls compression behavior and therefore tablet weight.
Process Variability Chart
A Process Variability Chart provides a quick visual overview of how results vary across different sources. Data are arranged by factor such as time, analyst, method, equipment, or batch. The chart allows rapid comparison of both the mean position and the spread of results between groups.
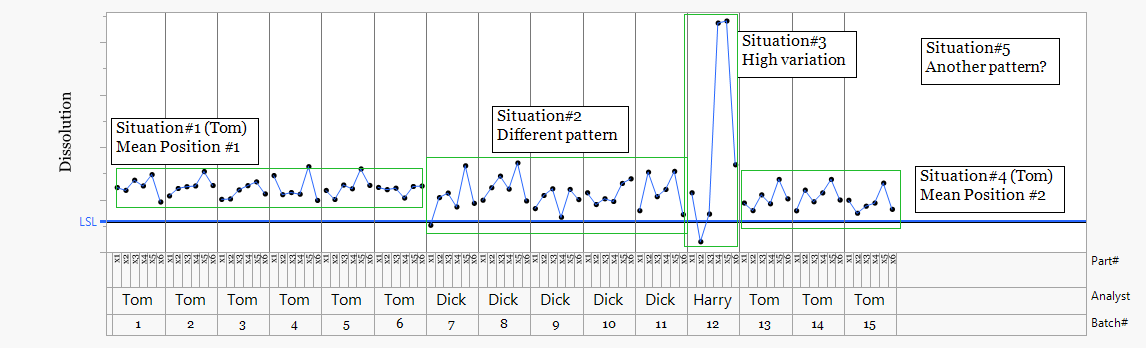
This view helps identify where differences may exist within the process. Variation between analysts, shifts in mean position, or unusual patterns can often be seen immediately.
-
The chart does not attempt to explain the cause. It provides a structured starting point for reviewing the data.
However the interpretation is still limited because the order of data may not reflect how the process actually operates. Important patterns can remain hidden when measurements from different conditions are combined.
Rational Subgrouping
Rational subgrouping (one of the most significant strategic tool when analyzing process behavior charts) takes the analysis one step further. Instead of grouping data only by category, measurements are organized in the order they were produced and according to the conditions under which they were generated.
-
Measurements collected under similar process conditions are grouped together so that the natural variation of the process becomes visible. Differences between analysts, batches,
instruments, or time periods then appear as shifts or changes in variation.
This approach allows the data to reflect the true behavior of the process. Once the results are organized in rational subgroups, Process Behavior Charts become far more powerful.
Changes in mean position, increases in variability, or unusual patterns can be detected quickly and linked to specific causes.
By QC Analyst
-
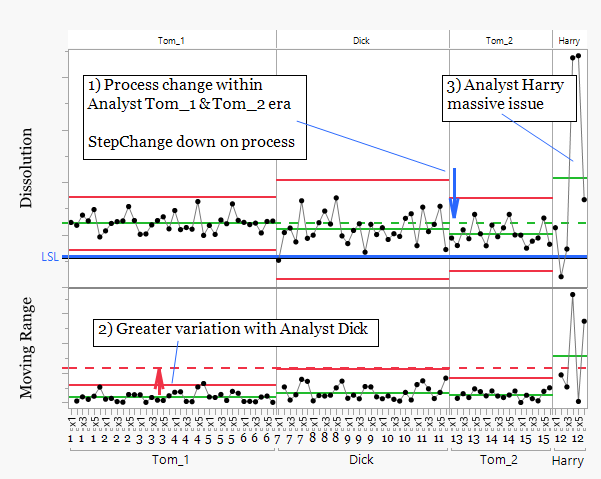
Analyst Tom appears in two periods, Tom_1 and Tom_2. The mean position shifts downward between these periods. This could initially suggest a change in Tom's working practice. However, the same step change appears when analyst Dick begins testing. This indicates the shift is more likely related to a process change rather than analyst technique.
The moving range chart shows greater variation during the period when Dick performed the analysis. The analytical results were less consistent during this phase, suggesting either changing process behavior or variation introduced during testing.
The results from analyst Harry show substantially higher variability than the other analysts. This pattern is consistent with an analytical consistency issue rather than a process shift. In this case Harry was performing his first solo analysis.
By Process
-
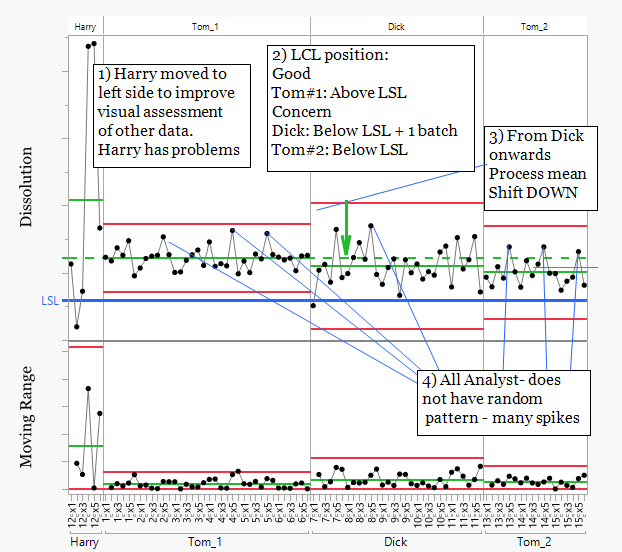
Harry shows unusually high variation compared with the other analysts. His data were moved to one side of the sequence to allow clearer assessment of the remaining analyst data.
The LCL position highlights potential risk. Tom_1 operates above the LSL and appears relatively stable. Dick operates close to or below the LSL with one batch clearly outside the limit. Tom_2 also operates close to the LSL, indicating a reduced safety margin against dissolution failure.
A clear step change in the process mean occurs between Tom_1 and Dick. The lower mean level remains consistent through Dick and Tom_2. Given Tom's experience as an analyst, the consistency across multiple analysts suggests the step change originates from the process rather than analyst technique. Both the QC method and the manufacturing process should still be reviewed.
The moving range chart shows several spikes at potentially regular intervals. This pattern suggests an additional source of variation and warrants further investigation, including review of QC equipment performance.
By Dissolution Equipment
Conclusions
Rational subgrouping organizes measurements produced under similar conditions so process behavior becomes visible. The method strengthens understanding of process data and links shifts to analysts, equipment, batches, or process changes. Effective use requires strong knowledge of process behavior and context,
expertise held within Verto Pharma.
-
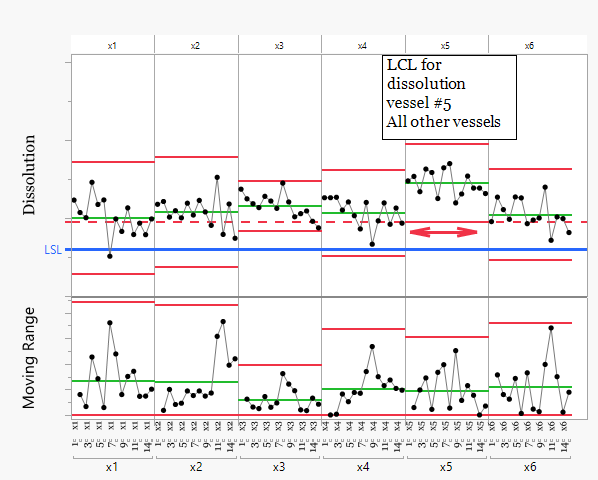
Harry's data have been removed from this analysis as a training issue was previously identified.
Vessel x5 shows consistently higher dissolution results than the other vessels. The lower control limit calculated from vessel x5 lies above several results from the other vessels. This pattern indicates that vessel x5 operates at a higher mean level and therefore releases drug faster than the other vessels
-
Two analyst-related issues were identified during the investigation.
Harry had been allowed to perform dissolution testing without adequate verification of competency. This was his first solo analysis. The training system did not require a supervised verification step before independent testing. The SOP has been updated so that new analysts must perform five analyses in parallel with an experienced analyst before working independently.
Dick's results showed higher variability linked to pipetting technique during sample preparation and transfer. Variability in pipette handling can introduce analytical variation through:
Inconsistent aspiration and dispensing technique
Incomplete sample transfer
Air bubbles in the pipette
Inconsistent immersion depth
Insufficient pipette calibration checks
Following retraining and implementation as the procedure was inadequate, the analytical variation returned to levels consistent with the other analysts.
-
The investigation confirmed a change in the manufacturing process. One of the raw materials showed a shift in particle size distribution. The material remained within the approved specification, but the change was sufficient to affect dissolution performance.
Although compliant, the change in particle size altered the surface area available for dissolution and therefore influenced the drug release rate observed in testing.
Corrective actions were implemented to improve monitoring and supplier communication.
Particle size distribution was added as a monitored parameter within the raw material Continued Process Verification program.
Quality agreements with suppliers were updated to require notification and assessment of any significant shifts in raw material characteristics, even when the material remains within specification.
These changes ensure that future raw material variability with potential impact on product performance is detected and evaluated earlier in the process.
-
The investigation identified a mechanical issue with dissolution vessel x5. The paddle height was set approximately 5 mm lower than specified. The reference marking on the shaft had been incorrectly positioned, which led to the incorrect setup.
A lower paddle position increases local shear near the tablet and changes the hydrodynamic conditions in the vessel. This results in faster drug release and explains why vessel x5 consistently produced higher dissolution results than the other vessels.
Corrective actions were implemented to prevent recurrence.
The paddle height was reset to the correct position
The incorrect shaft marking was removed and replaced with a verified reference point
The calibration SOP for the dissolution apparatus was updated so paddle height is verified using a mechanical gauge rather than relying on shaft markings.
These changes ensure consistent hydrodynamic conditions across all vessels and improve the reliability of dissolution testing.