
Regulatory guidance across major agencies follows a common lifecycle structure for process validation. Authorities including the U.S. Food and Drug Administration, European Medicines Agency, Pharmaceutical Inspection Co-operation Scheme, and Pharmaceuticals and Medical Devices Agency apply broadly aligned expectations.
Process validation follows three main stages.:
STAGE #1: Process Design
The manufacturing process is defined during development. Experimental studies, risk assessments, and scale up work establish process understanding and identify the variables influencing product quality. These activities define the control strategy used for commercial manufacture.
STAGE #2: Process Qualification
(1) Facility, utility, and equipment qualification and (2) Process Performance Qualification (PPQ)
The manufacturing process is evaluated at commercial scale to confirm that facilities, equipment, utilities, and process controls operate as intended. Qualification batches demonstrate that the process performs reproducibly under routine manufacturing conditions.
STAGE #3: Continued Process Verification (CPV) / Ongoing Process Verification (OPV)*
(1) Continued / Ongoing* Process Verification monitoring and
(2) Product Quality Review / Annual Product Review*
Routine manufacturing data are evaluated throughout the commercial lifecycle to confirm that the process continues to operate with predictable performance. Ongoing monitoring, statistical analysis, and investigation of unexpected variation provide continued assurance of product quality.
While terminology and documentation expectations differ slightly between regulatory frameworks, the underlying lifecycle structure remains consistent across major global regulatory authorities.
For communication of Verto Pharma services in a commercial context,
the process validation lifecycle will be presented in reverse order
to show how early validation activities influence real manufacturing performance and ongoing process control.
where * denotes EU definitionProcess Validation

Meeting specification keeps you compliant today
Understanding variation keeps you compliant tomorrow
STAGE #3: Continued Process Verification (CPV) / Ongoing Process Verification (OPV)
Continued Process Verification (CPV) begins once the manufacturing process has been transferred from development to commercial production and Process Performance Qualification (PPQ) has been successfully completed. At this point the clinical batches and PPQ batches together establish the baseline understanding of process behavior.
-
Development studies identify and evaluate process factors that influence product quality. These factors are documented in regulatory submissions and reflect the current understanding of how the process affects product performance.
The graphic below represents the status of this knowledge at the moment commercial manufacture begins. Factors with a demonstrated impact on product quality are classified as critical and are actively monitored during routine manufacture. Other factors have been shown to have minimal impact or were not investigated during development.
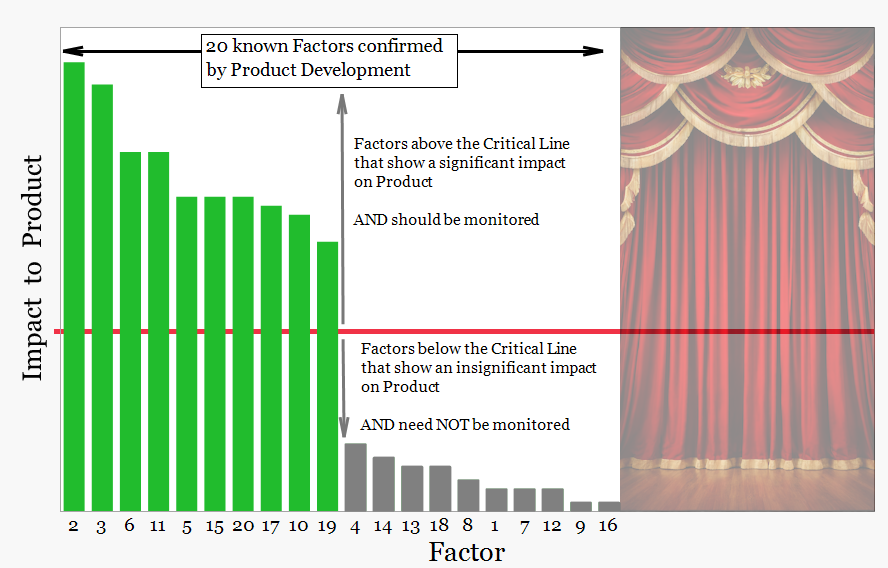
adapted from Wheelers Different Approaches to Process Improvement (2022), Quality Digest
-
These factors show a demonstrated impact on product performance or quality attributes and are monitored during routine manufacture. (Green bars)
-
These factors have been evaluated and shown to have minimal or no meaningful impact on product performance within the studied range. Routine monitoring is not required. (Grey bars)
-
Development studies did not investigate these factors because available knowledge indicated no plausible impact on product quality.
-
Some factors were not investigated because of practical limitations in development studies. Their impact remains uncertain and may require evaluation during commercial manufacture.
Behind the curtain lies the future product lifecycle. As commercial manufacturing continues, new sources of variation may emerge and previously unrecognized factors may begin to influence product behavior. Continued Process Verification monitors process performance over time to detect these signals and determine whether additional factors should be incorporated into the monitoring strategy.
So what is behind the curtain?

Hidden Factors
Behind the curtain are factors not identified during development. These factors may act independently or interact with known variables and gradually influence product quality.
As manufacturing continues, some of these factors may emerge as new sources of variation.
If they remain unrecognized, process behavior can drift and the
State of Control may be compromised.
Continued Process Verification is designed to detect these emerging signals. When new drivers of variation are identified, they can be investigated and incorporated into the monitoring strategy to maintain control of the process.
Each new manufactured batch is compared against the historical control limits established from the available clinical and PPQ batches. As additional commercial batches are produced, they are progressively incorporated into the monitoring dataset. Individual and Moving Range charts are used to assess process behavior and detect emerging signals of variation.
-
As the number of commercial batches increases and a sufficient body of data has been generated to reflect true manufacturing conditions, the control limits are fixed. Fixing these limits prevents gradual drift in process performance. Any future changes to these limits can only be implemented through formal change control.
This approach ensures that the monitoring framework evolves with the process during early commercial manufacture while maintaining sensitivity to changes that could affect product quality.
Evolving Process Understanding Through CPV
As commercial manufacture progresses, ongoing monitoring confirms stability while revealing gaps in process understanding. Emerging signals lead to reclassification of existing factors and identification of new drivers.
The monitoring strategy is updated to reflect actual process behavior, ensuring control is maintained as knowledge improves.
Previously unmonitored factor now reclassified
As routine manufacturing continues, Continued Process Verification evaluates process behavior over time.
-
At this stage the curtain opens, revealing how the process behaves under real manufacturing conditions. Monitoring of the critical factors may reveal changes that indicate the influence of additional variables previously considered insignificant or not recognized during development. When such signals appear they are investigated through the quality management system and, where appropriate, the relevant factors may be reclassified and incorporated into the monitoring strategy.
Processes do not remain static. Natural entropy, changes in raw materials, equipment wear, environmental conditions and operational variability can all influence behavior over time. CPV provides the framework to detect these emerging drivers and incorporate them into the monitoring strategy, ensuring the process remains in a State of Control throughout the product lifecycle.
2. New factors identified during CPV
As commercial manufacturing continues, Continued Process Verification evaluates process behavior across an increasing number of batches.
-
Monitoring of process performance focuses on the critical factors identified during development and confirmed during PPQ.
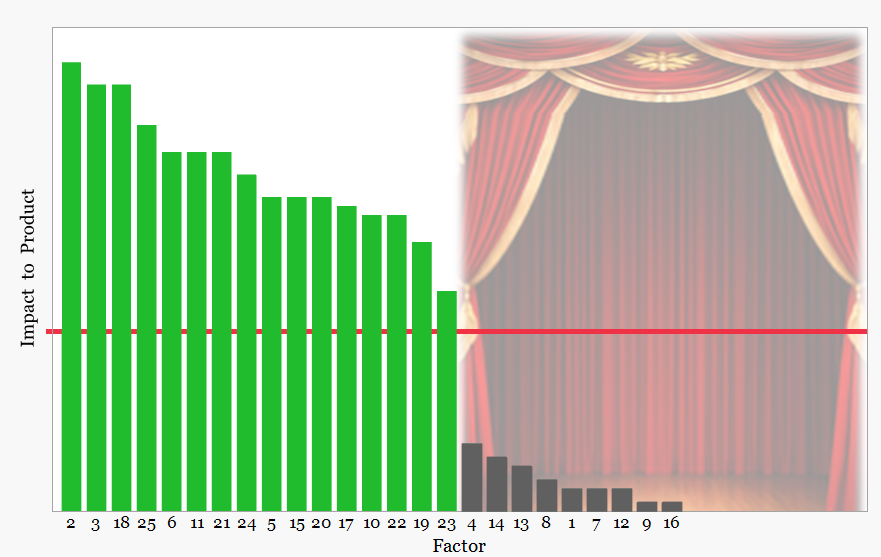
From left to right, the figure illustrates how monitoring of these established factors may reveal additional drivers influencing process behavior. Changes in the behavior of monitored factors may initially appear as weak signals below the monitoring threshold. As more manufacturing data becomes available, these signals may strengthen and indicate the presence of previously unrecognized variables.
When such signals appear they are investigated through the quality management system. Where an underlying driver is confirmed, the relevant factor is promoted into the monitoring strategy and incorporated into the Continued Process Verification framework.
The curtain on the right side of the figure represents the unknown drivers that may emerge during the product lifecycle. It deliberately overlaps the unmonitored factors, reflecting that variables previously considered insignificant may later influence process behavior and require reclassification.
The degree to which the curtain is open reflects the effectiveness of the process behavior monitoring framework. Effective use of behavior charts improves visibility of emerging signals in the monitored factors and allows previously hidden drivers of variation to be identified.
When confirmed through investigation, these newly recognized drivers can be promoted into the monitoring strategy, ensuring the process remains in a State of Control throughout the product lifecycle.
Why continual improvement never stops throughout the Product Lifecycle?
Entropy never stops, and changes to a product introduce additional layers of risk that must always be managed. To mitigate these risks effectively, the implementation of process behavior charts within Continued Process Verification is critical.
-
Without effective behavior chart monitoring, visibility of emerging process drivers is reduced and the curtain begins to close. Maintaining robust monitoring ensures new sources of variation are detected early and incorporated into the monitoring strategy, allowing the process to remain in a State of Control throughout the product lifecycle.
Deliverables
-
Design and implementation of a structured behavior chart framework that supports reliable monitoring of process performance during Continued Process Verification.
-
A clear visual dashboard that allows rapid assessment of process behavior and consistency with specification requirements, supporting ongoing verification of the State of Control.
-
Statistically appropriate rule sets tailored to the process and sample size, providing clear guidance on when to react and when not to react. Excessive rule sets increase the risk of false signals and unnecessary intervention. The objective is not perfection but excellence, using rules that reliably detect meaningful change while avoiding overreaction to routine variation
-
Support tailored to organizational needs. This includes full service implementation, periodic independent review of monitoring systems, or mentoring of internal staff responsible for CPV monitoring.
-
Integration of process behavior charts directly into Word based templates for Annual Product Review and Continued Process Verification reporting. The structure ensures charts, interpretation, and supporting commentary are presented consistently across reporting cycles, supporting clear assessment of process behavior and verification of the State of Control.
Statistical Foundations for Process Qualification
Regulatory guidance expects the use of appropriate statistical methods during Process Performance Qualification (PPQ), including sampling plans that provide statistical confidence and statistical analysis of intra- and inter-batch variability. While regulators do not prescribe a specific statistical tool, robust statistical evaluation of process performance is an explicit expectation.
STAGE #2: Process Qualification
-
Process behavior charts provide the only statistical method that evaluates process performance across a timeline to determine whether a system is operating in statistical control.
This is important because most classical statistical methods assume that the data being analyzed originates from a stable system.Traditional statistical tools such as t-tests, analysis of variance (ANOVA), confidence intervals and acceptance sampling approaches (AQL) are commonly used to evaluate process variation and compare datasets. However, these techniques assume the underlying process is stable.
Modern modelling approaches such as principal component analysis (PCA), multivariate analysis and machine learning methods such as bootstrap forest models are increasingly used to explore relationships between variables and identify potential drivers of variation. These approaches also rely on the assumption that the underlying dataset represents a stable process.
Verto Pharma therefore recommends the integration of process behavior charting with process capability analysis using Ppk. Behavior charts confirm that the process is stable and predictable, while capability analysis evaluates whether the natural process variation remains within specification limits. Together these approaches provide strong statistical assurance that the process operates in a State of Control and meets regulatory expectations.
This statistical framework also supports the development of effective sampling strategies during equipment qualification and PPQ, balancing statistical confidence, manufacturing representativeness, analytical capability and sampling cost. The behavior chart structure established during qualification provides the statistical baseline for Continued Process Verification during commercial manufacture.
Deliverables
-
Development of a sampling strategy for equipment qualification and PPQ that balances statistical confidence, representativeness of manufacture, analytical capability, and cost. The plan also considers the operational impact on supporting departments such as Quality Control and ensures clear project costing and resource planning.
-
A structured statistical interpretation of process behavior using behavior charts. This narrative explains process stability, identifies signals of variation, and provides a clear statistical explanation of process performance during qualification.
-
Design and implementation of a structured behavior chart system with clear interpretation narratives. This framework demonstrates process consistency, confirms the ability of the process to meet specification, and supports verification that the process operates in a State of Control.
-
Process behavior charts and statistical narratives generated during equipment qualification and PPQ are structured so they can be readily incorporated into regulatory CMC documentation. The chart format, statistical interpretation, and supporting narrative are prepared in a clear and consistent manner that aligns with expectations for regulatory submissions. This allows the statistical evidence of process stability, capability, and State of Control to be transferred directly into CMC filings, technical reports, and lifecycle management documentation without the need for reanalysis or reformatting.
5.Foundation for Continued Process Verification
Establishment of the statistical framework for CPV. This includes identification of follow-up activities arising from PPQ, such as seasonal considerations, additional monitoring requirements, or further testing needed to confirm process understanding under different manufacturing conditions.
-
Establishment of the statistical framework for CPV. This includes identification of follow-up activities arising from PPQ, such as seasonal considerations, additional monitoring requirements, or further testing needed to confirm process understanding under different manufacturing conditions.
Design of Experiments (DoE) is widely used during development to understand how process parameters influence product quality. However, DoE studies often analyze datasets using classical statistical comparisons without evaluating whether the system itself is stable. Integrating Statistical Process Control (SPC) into development allows process behavior to be assessed across the experimental timeline and provides an early understanding of process consistency.
STAGE #1: Process Design
-
A common misconception is that SPC requires large datasets of 25 to 30 samples. In practice, behavior charts can provide valuable insight even with smaller datasets, making them highly useful during development. When applied alongside DoE studies, SPC allows researchers to observe emerging trends, detect unusual variation, and better understand how process factors influence intra-batch variability.
As development progresses toward late-stage development and PPQ preparation, behavior chart analysis becomes particularly valuable in designing statistically justified sampling plans. Monitoring intra-batch variation using behavior charts ensures that sampling strategies capture representative process behavior while maintaining statistical confidence.
The natural limits of behavior charts are derived from the inherent variation of the system. When observations exceed these limits, it provides a strong signal that a meaningful change in process behavior has occurred. These signals support timely and economically justified decisions during development and provide a statistical foundation that can be carried forward into PPQ and early trending within Continued Process Verification.
Understanding Process Behavior with Small Datasets
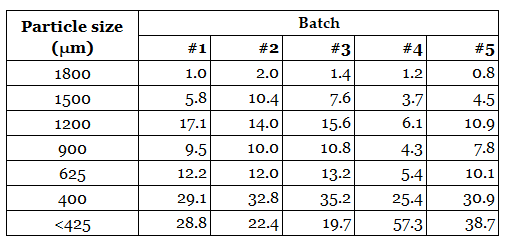
Development data are often presented in tabulated form, as shown in the example above. While this format provides the raw measurements, identifying meaningful patterns requires careful interpretation and often relies on subjective judgement. Subtle shifts in process behavior can easily be overlooked when reviewing tables alone.
-
Rather than simply plotting all available data, a structured statistical approach was used. In this example, behavior chart limits were estimated using three of the five batches to establish an initial reference for expected process variation. These limits represent the natural variation of the system under typical conditions.
When the remaining batches were evaluated against these limits, it became immediately clear that Batch 4 behaved differently from the established pattern. The particle size distribution showed a pronounced increase in the proportion of fines (<425 µm) at the expense of larger particle fractions.
This difference was consistent with the observed manufacturing outcome, where Batch 4 produced friable tablets due to the excess of fine particles in the blend.
This example illustrates an important principle in process development. Even with relatively small datasets, behavior charts can reveal meaningful shifts in process behavior and provide early process understanding. Establishing these limits during development allows useful statistical baselines to be formed that can later support Process Performance Qualification and early monitoring within Continued Process Verification.
1.Tabulated Development Data
-
If any trends are visible, it is challenging to
communicate them clearly.
Development data are often presented in tabulated
form. While the values are visible, identifying meaningful patterns requires careful inspection and often relies on subjective judgement. Subtle shifts in process behavior can easily be overlooked when reviewing tables alone, particularly when multiple variables and batches are involved.
2.Behavior Chart Using All Batches (n=5)
-
The data are rationally sub grouped, but the control limits are calculated using all batches.
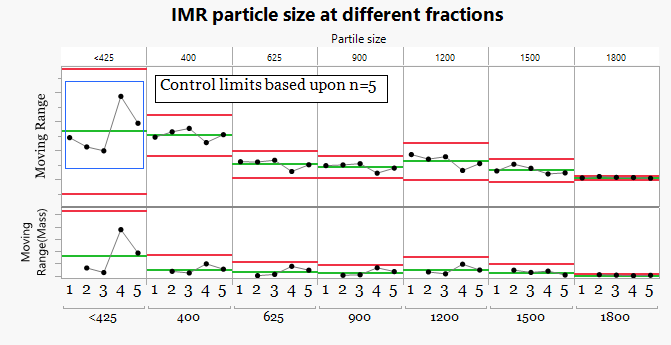
To better understand the process behavior, the particle size fractions were evaluated using Individual and Moving Range behavior charts. In this first view, control limits were calculated using all five batches.While the data are now visualized across a timeline, including all batches in the limit calculation masks the presence of unusual variation and reduces the sensitivity of the chart to detect meaningful differences between batches.
Unfortunately this approach is common practice and can lead to important process signals being overlooked.
3.Behavior Chart Using n=3 Batches
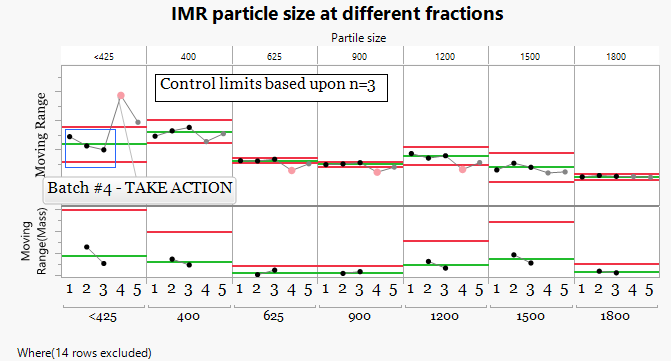
-
Control limits were calculated using three batches that represent typical process behavior. The remaining batches were then evaluated against these limits.
A more structured approach was used by establishing control limits using three batches that represent typical process performance. When the remaining batches were evaluated against these limits, Batch 4 immediately shows behavior outside the expected range.The particle size distribution contains an excess of fine particles (<425 µm) at the expense of larger fractions.
This shift in particle size distribution was consistent with the manufacturing outcome, where Batch 4 produced friable tablets.
This example demonstrates that even with small datasets, behavior charts can reveal meaningful differences in process behavior and allow useful statistical limits to be established early in development.