Follow-up to Process Behavior Charts: Separating Behavior from Specification
The debate around specification limits on control charts continues to generate strong opinions.
Before answering whether they should be shown, we first need to distinguish between two very different use cases.
The blog identifies two separate objectives:
Process control during manufacture
Process understanding and reporting after manufacture
Control charts and specification limits answer different questions.
Control charts are used to determine whether it is economically worthwhile to take action on a process, or to leave the process unchanged, based on observed variation relative to statistically derived three-sigma limits.
Their role is to:
Maintain process stability by distinguishing between routine variation and exceptional variation requiring investigation or intervention.
Provide confidence that the process is operating consistently such that sampled results are more likely to reflect the wider batch condition.
Specification limits serve a different purpose.
They are used to determine whether a batch meets agreed product quality requirements as approved with regulatory authorities.
Their purpose is acceptance, not process control.
That said, the relationship between control limits and specification limits remains critical, and regulatory frameworks require this understanding to be reviewed through APR/PQR (annual reviews) and OPV/CPV (more frequent reviews).
Walter A. Shewhart demonstrated this concept, where action limits (A and B) are shown alongside specification limits (L1 and L2).
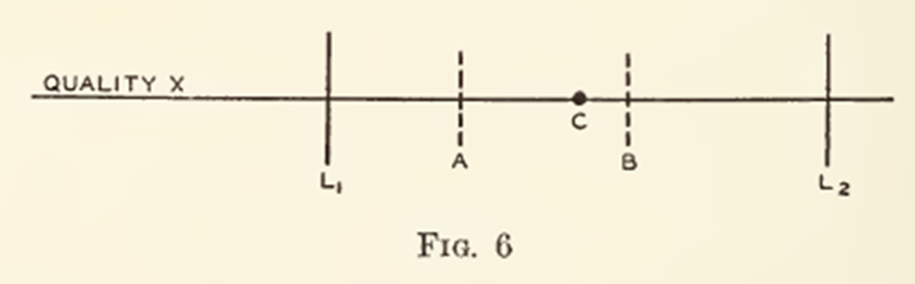
Fig. 6 of Statistical Method from the Viewpoint of Quality Control (1939)
This demonstrates that Shewhart recognized both concepts as related, but fundamentally serving different purposes.
Their relationship is important:
Where action limits remain within specification limits, the process has operating margin.
As action limits approach specification limits, the available operating margin reduces.
Where action limits exceed specification limits, routine process variation exceeds the specification window, suggesting the process may lack sufficient robustness to reliably maintain future compliance without improvement.
To be clear, Shewhart does not advocate displaying specification limits on control charts as part of his charting methodology. Any broader interpretation is therefore an extension of the conceptual relationship he presents.
It must also be recognized that any value within L1 to L2 constitutes a conforming batch, regardless of where A and B are positioned outside of the specifications.
However, when reviewing batch-to-batch performance, the relationship between routine process variation and specification limits becomes an important consideration when assessing long-term process robustness and future manufacturing risk.
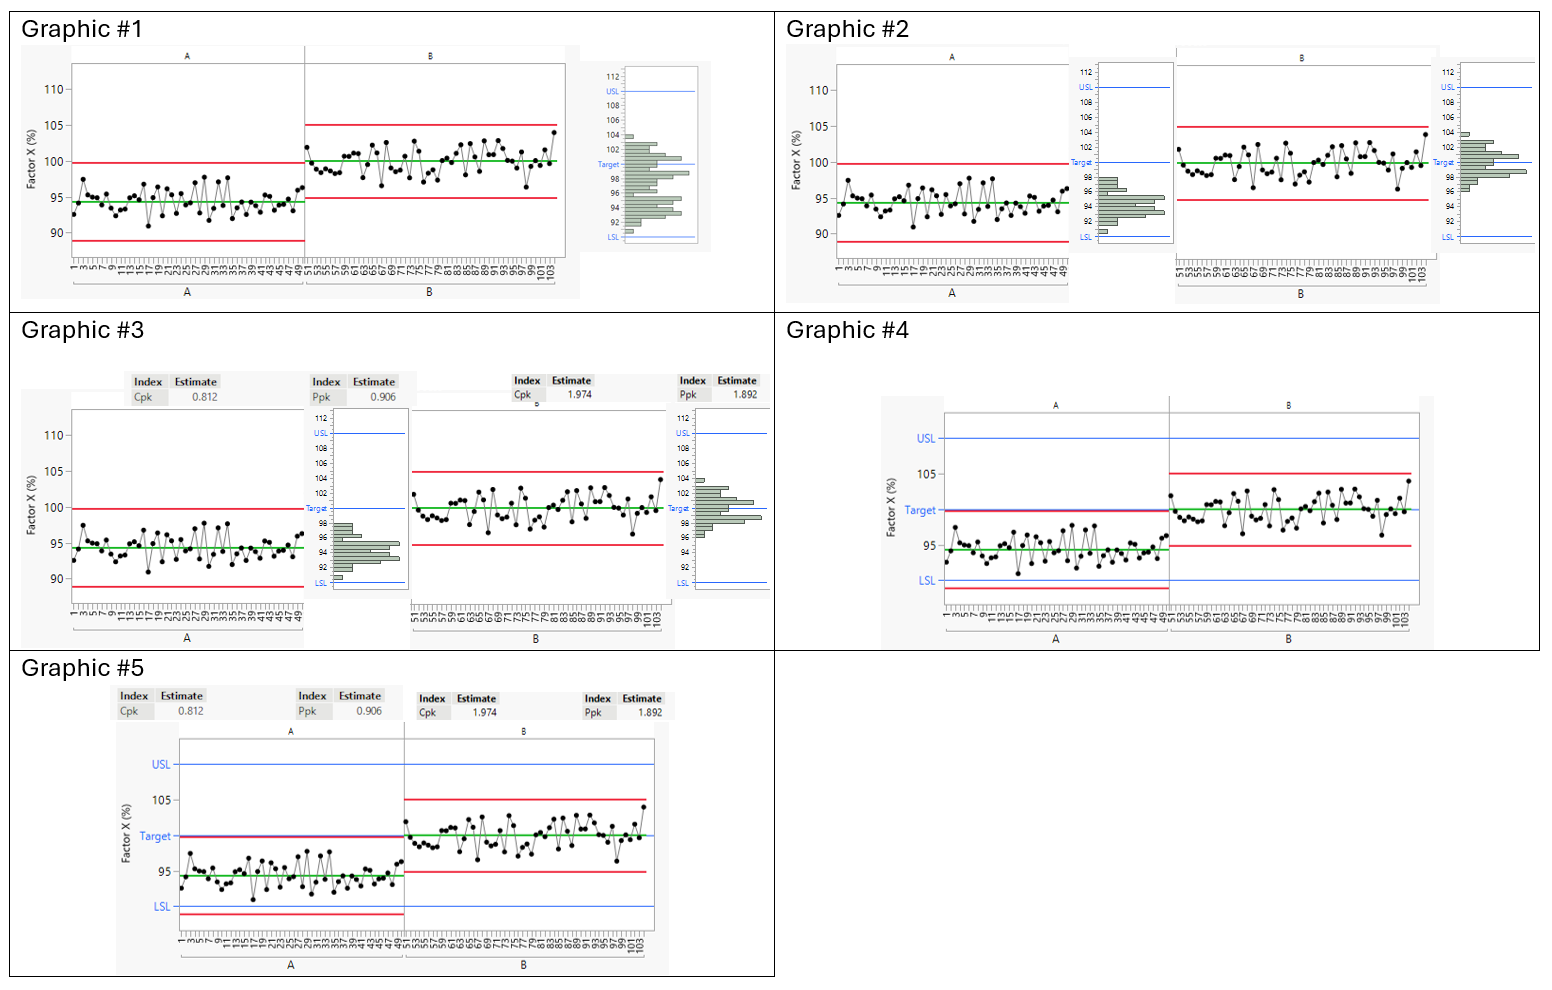
Following the feedback on the blog, I have prepared five alternative reporting formats.
All five examples show the same scenario:
Two different process states of the same Product, are shown A and B
Batches within A are consistent
Batches within B are consistent
A and B differ from one another
All batches meet specification